Infographic Animation Services

Your data wants to tell a story. Most B2B presentations just bury it. lose the room. miss the point. never land.

Data without narrative gets skipped. We build the kinetic story that makes your architecture diagrams, financial models and platform logic impossible to ignore. Used by AWS, Aiven, Fujitsu and 2,000+ B2B brands.

See examples
Or estimate your upside with the ROI calculator ↓
Aiven software infographic animation
AivenSoftware InfographicInfographic · Best Rated
Aiven platform architecture infographic animation
AivenPlatform ArchitectureSaaS · Cloud
AWS NCM Connected Everywhere enterprise infographic animation
AWSNCM ConnectedEnterprise · Infographic
Dechen Consulting corporate presentation kinetic typography animation
DechenCorporate PresentationKinetic Typography
Quadient AP automation finance infographic animation
QuadientAP AutomationFinance · Infographic
Telin isometric network diagram infographic animation
TelinIsometric NetworkInfographic · Isometric
Fujitsu Gen AI platform enterprise motion infographic animation
FujitsuGen AI PlatformEnterprise · Motion
UCI Health training healthcare data infographic animation
UCI HealthTrainingHealthcare · Data
2,448+Videos Delivered
15+ yrsIn Production
4.8Clutch Rating

The B2B content gap

B2B teams produce content
every week.
Buyers remember none of it.

You spent weeks on the deck. Legal reviewed it. The designer polished every slide. The video took three months. And the prospect who received it opened it once and never came back.

The content wasn't bad. The data was solid. But data without a narrative gets skipped — no matter how accurate, how detailed, or how expensive it was to produce.

That gap — between data you're proud of and a story buyers remember — is the only thing infographic animation exists to close.
The data says

"Record growth. 94% satisfaction. Category-leading NPS." Numbers that should close deals on their own.

The deck shows

A table. A bar chart. Three bullet points. Technically accurate. Emotionally absent.

Infographic animation does

Makes the numbers move like the story they are — so buyers feel the weight, not just read the width.

$4.8M counting now
in B2B content produced this week that buyers will never watch — because it stopped at the second box

Work that moved the needle

See it in
your industry

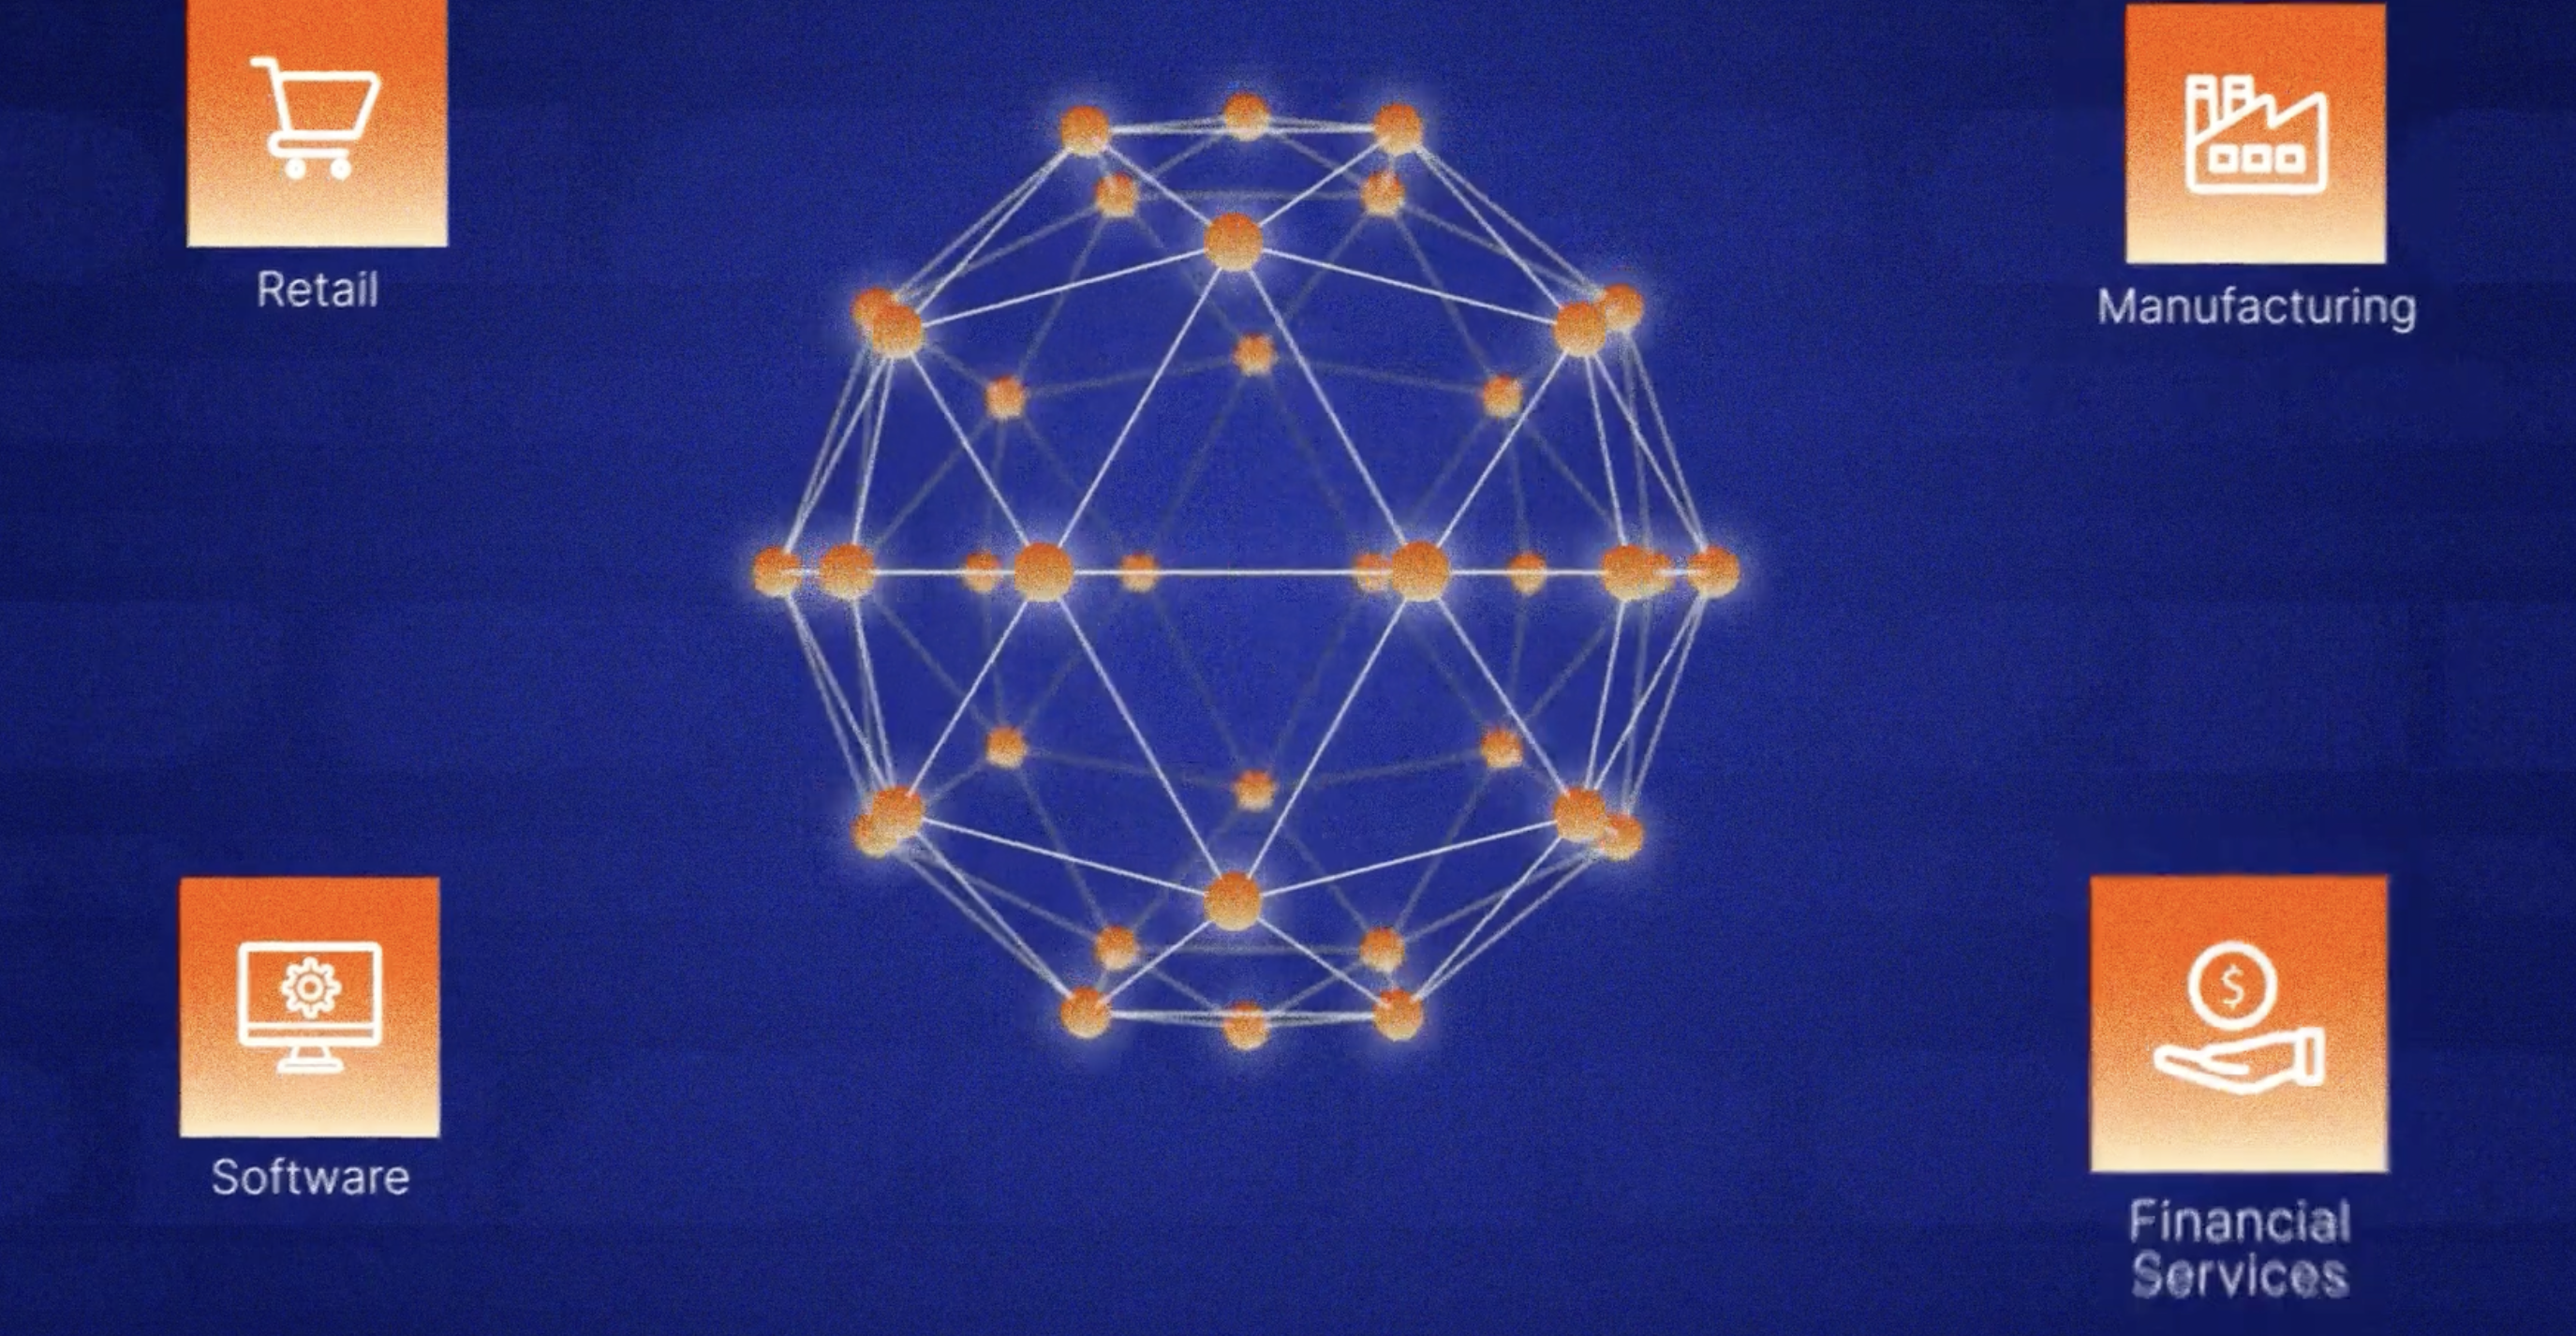
Every B2B category has data that isn't landing. We've worked across them all. Pick your world and see what happened.

Data visualisation

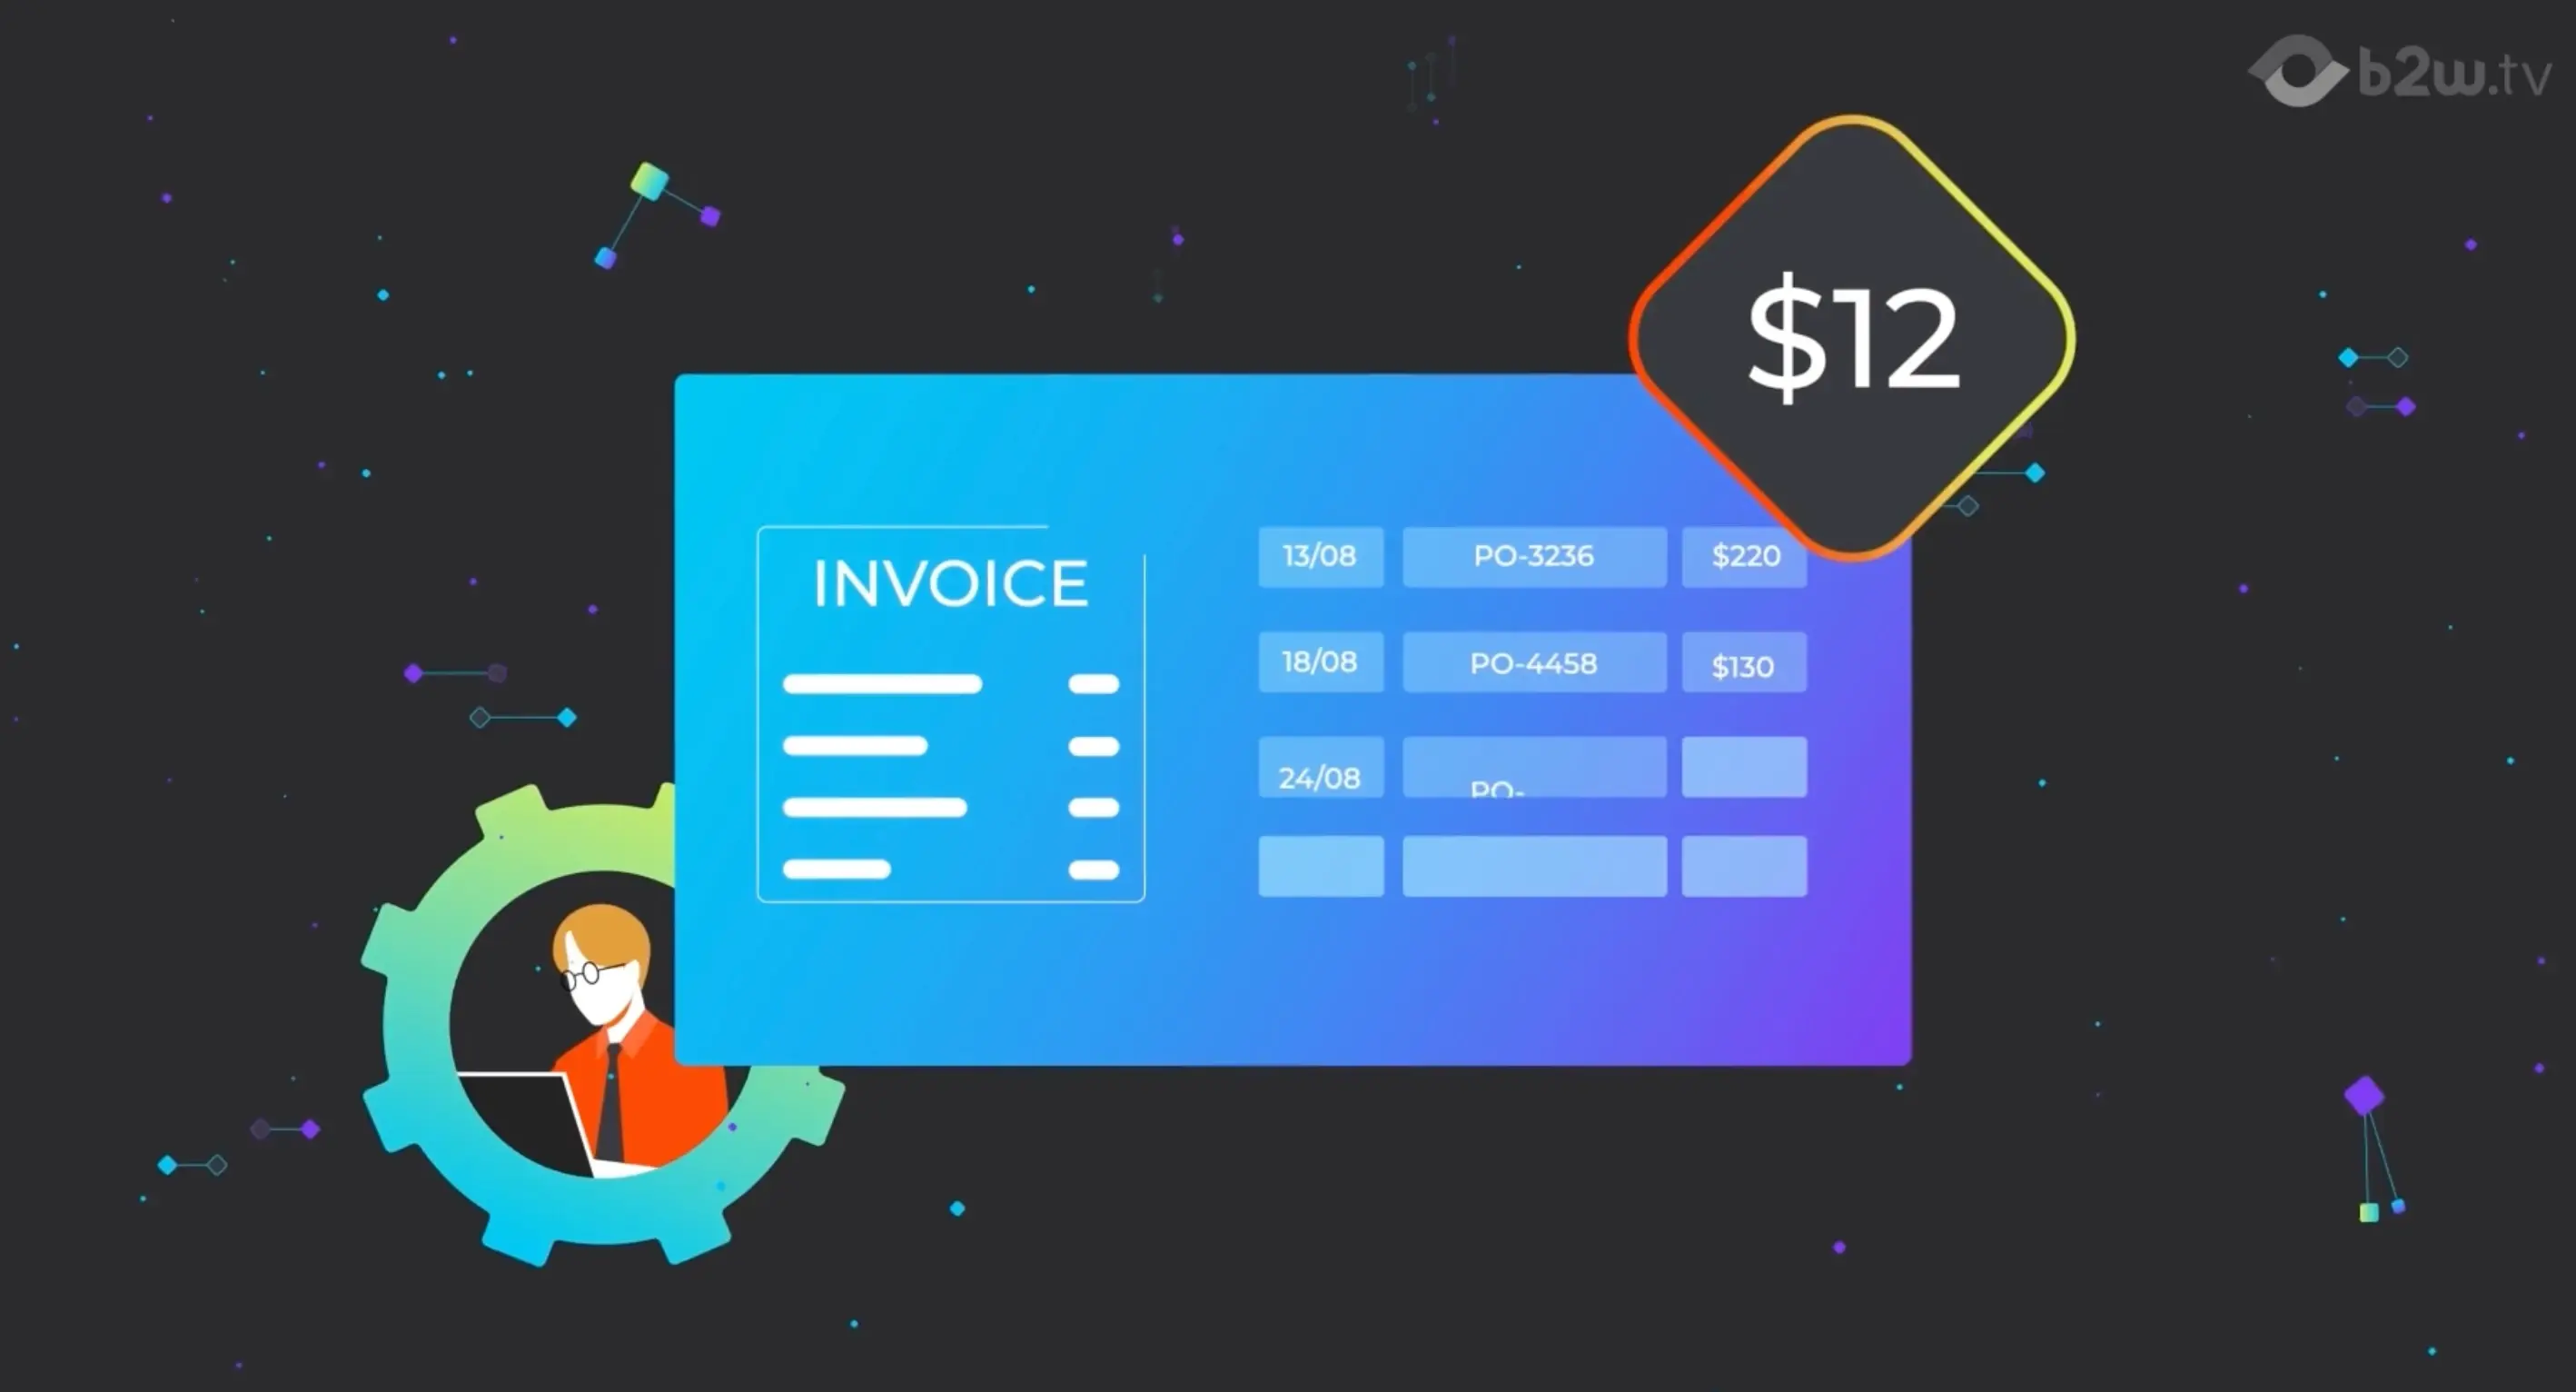
Metrics that build on screen and hit with the weight the numbers deserve

Platform architecture

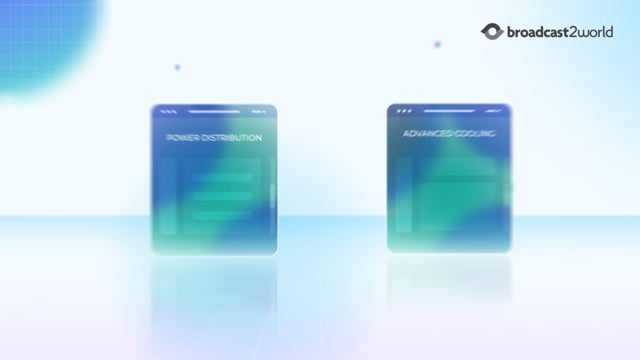
Kinetic system diagrams non-technical buyers actually follow

Process & workflow

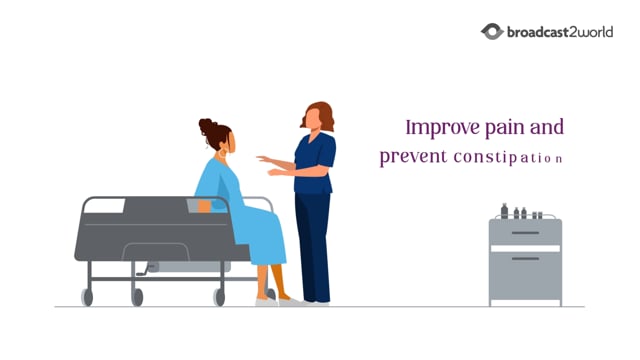
Operational logic made so visual it sells itself without a presenter

Kinetic typography

Copy that moves with intent — each word landing at the moment it counts

Statistical storytelling

Numbers given narrative weight so the story your data hides finally lands

Tradeshow & presentation

Screen and stage content built for the 90 seconds you actually have

SaaS & Cloud platform animation

Platform architecture that took three years to build shouldn't take 45 minutes to explain. We turn distributed systems, API flows, and cloud infrastructure into kinetic diagrams developers share and buyers remember.
  • Platform and product architecture diagrams
  • Developer onboarding and activation explainers
  • Technical feature launch animations
  • Competitive differentiation infographics
  • Sales and marketing motion infographics
Aiven Software
Aiven — Software InfographicInfographic · Best Rated
Aiven
Aiven — Platform ArchitectureSaaS · Cloud
Data Center AI Infrastructure Infographic — Broadcast2World
Data Center AI — Infrastructure InfographicSaaS · Infographic

Tech & Enterprise infographic animation

Enterprise buyers need to feel the ROI before they approve the budget. We build infographic videos that translate complex productivity data, system integrations, and business outcomes into formats that travel up the chain.
  • ROI and business case visualisation
  • System integration and workflow diagrams
  • Product launch and feature explainers
  • Tradeshow and event infographic content
  • Internal and board-level data storytelling
AWS NCM
AWS — NCM Connected EverywhereEnterprise · $30M ROI
Fujitsu Gen AI Platform — Broadcast2World
Fujitsu — Gen AI PlatformEnterprise · Motion
Telin Isometric Network Diagram — Broadcast2World
Telin — Isometric Network DiagramInfographic · Isometric

Corporate presentation & kinetic typography

A strategy that 12 executives interpret 12 different ways isn't a strategy — it's a liability. We build animated presentations that unify the narrative and make the message impossible to misread.
  • C-suite and board presentation animation
  • Kinetic typography for brand positioning
  • Investor and fundraising explainer videos
  • Annual report and data storytelling
  • All-hands and internal communications
Dechen Consulting-1
Dechen Consulting — Corporate PresentationKinetic Typography · C-suite
Vanderbilt Infographics
Vanderbilt — Infographic SeriesCorporate · Infographic
Siemens (1)-1
Siemens — This is the SpaceCorporate · Motion

Finance & fintech infographic animation

Financial data is precise. It's rarely felt. We close that gap — turning AP workflows, cost-reduction models, and investment theses into animated infographics that make the numbers land with buyers, not just analysts.
  • AP and AR automation workflow explainers
  • Cost reduction and ROI visualisation
  • Investment thesis and fund explainers
  • Regulatory and compliance process diagrams
  • Financial platform onboarding animation
Quadient AP
Quadient — AP AutomationFinance · 83% cost reduction
MSA
MSA — Investment InfographicFinance · Investor
Tricolor
Tricolor — Financial Services InfographicFinance · Infographic

Healthcare data & training animation

Clinical data without visual narrative gets ignored by the people who need to act on it most. We build animated infographics that make training stick, compliance improve, and health data understood.
  • Clinical staff training and onboarding
  • Health data and outcomes visualisation
  • Patient pathway and process diagrams
  • Public health campaign infographics
  • Health tech platform explainers
HonorHealth ERACS Infographic — Broadcast2World
HonorHealth — ERACS InfographicHealthcare · Infographic
Corridor Episode IQ
Corridor — Episode IQHealthcare · Data
Lenovo Meldcx
Lenovo MeldCx — Health Tech PlatformHealthcare · Health Tech

Seen something close to your use case?

Book a strategy call Estimate your ROI first ↓

Why Broadcast2World

15 years turning complex data into stories
buyers actually feel.

2,448+ videos. 500+ B2B brands. A production process built around narrative clarity, not just motion design.

SaaS & Cloud Enterprise Tech Financial Services Healthcare Corporate Comms Data & Analytics
Data first. Story always.
Our Framework

Every infographic animation starts from your data source — a report, a financial model, a platform architecture diagram. We don't decorate numbers. We find the story hiding inside them and build a motion narrative around it.

B2B-only. No generalist dilution.
500+ brands

We don't produce wedding videos. We don't do music videos or live events. 100% of our work is for B2B brands with complex products, long sales cycles, and buyers who respond to evidence — not emotion alone.

US relationships, global production speed
15+ yrs

New Jersey client team. India-based production studio. 15+ years serving US B2B brands with the turnaround speed and cost efficiency that matters when campaign deadlines don't move.

Script written to convert, not just explain
Included

Our Why-First framework opens with a truth the buyer already holds — before the product appears. Data-driven scripts that move people toward a decision, not just inform them of a fact.

Animation makes invisible data visible
No limits

Platform architecture. Supply chain flows. Financial models. Statistical comparisons. No photography, no stock footage, no clearance required. Animation is the only medium that can show all of it in one production.

Proven results across every B2B vertical
2,448+ videos

SaaS. Enterprise. Financial services. Healthcare. Corporate comms. 2,448+ infographic and motion projects across 15 years — from Fortune 500 enterprise to high-growth B2B SaaS.

Infographic ROI Calculator

What would a clearer infographic
be worth to you?

Adjust your numbers. See the difference a motion infographic could make on the deals you're already working.

Your numbers
Monthly page visitors5,000
500100k
Current conversion rate2.5%
0.5%15%
Average deal / contract value$25,000
$1k$500k
Lead-to-close rate20%
5%80%
Expected conversion lift
Your upside
Additional annual revenue
$2.3M
Additional leads / month +38/mo
Additional revenue / month $188k/mo
Payback period <1 month

These are your numbers. We can show you exactly how to move them — with examples from B2B brands in your category.

30 min · No commitment · Infographic-specific
Client Reviews

What our B2B clients say about Broadcast2World

Jessica Hodell - Epicor

"Your videos are one of my favourite projects at Epicor. It is always a blast working on them — the team brings genuine energy."

Jessica Hodell — Senior Marketing Specialist, Epicor  ·  ★★★★★ Clutch

Eyal

"Excellent and professional work delivered on time. The team was very proactive, diving into our technology and understanding our market."

Eyal Harel — CEO & Founder, BlueGreen Water Technologies  ·  ★★★★★ Clutch

woi-caldwell-courtney-bbf4506_900xx6048-3402-0-311 optimized

"B2W will always be my go-to choice. They go above and beyond to handcraft your script, deliver on time and on budget."

Courtney Caldwell — CEO, ShearShare  ·  ★★★★★ Clutch

image (6)-2

"We have been able to grow our social media following because of your work. Every time we publish one of your videos, engagement jumps."

Ronda J. Williams — Senior Marketing Manager, Hub International  ·  ★★★★★ Clutch

lawyer_adam_roa_1559830_1522960686-1 (1) optimized

"They were far more organised and thorough than competitors. A plan from day one — a professional product that spoke for itself."

Adam J. Roa — Owner, Law Offices of Adam J. Roa  ·  ★★★★★ Clutch

Michael - President - The MulTie Corp

"I would highly recommend Broadcast2World. The team was most concerned with customer satisfaction at every step of the process."

Michael Millican — Founder, The MulTie Corporation  ·  ★★★★★ Clutch

4.8
★★★★★
Overall Rating
on Clutch.co
Quality5.0
Communication5.0
Schedule4.9
Cost4.8
Would refer B2W100%
★★★★★

Your videos are one of my favourite projects at Epicor. It is always a blast — the team brings genuine energy to every frame.

★★★★★

Excellent and professional work delivered on time. Very proactive — diving into our technology and understanding our market.

★★★★★

B2W will always be my go-to choice. They go above and beyond to handcraft your script, deliver on time and on budget.

★★★★★

We have been able to grow our social media following because of your work. Every time we publish, engagement jumps.

★★★★★

They were far more organised and thorough than competitors. A plan from day one — a professional product that spoke for itself.

★★★★★

I would highly recommend Broadcast2World. The team was most concerned with customer satisfaction at every step of the process.

★★★★★

Outstanding project management — every deadline was met and communication was seamless throughout the entire process.

★★★★★

They are very detail-oriented and could grasp our complex concepts quickly. The final video exceeded expectations.

Questions about our infographic animation services

Infographic animation at Broadcast2World starts from $2,400 per finished minute. Most B2B projects run 1.5–3 minutes, putting typical budgets in the $4,000–$8,000 range. Standard delivery is 4–6 weeks from approved script; rush production is available. A free strategy call gives you an accurate quote within 24 hours. View full pricing →
Motion graphics is a broad term covering any animated visual — brand intros, kinetic typography, abstract animation. Infographic animation is a specific subset where the visual language is rooted in data: charts, diagrams, flows, and statistics that build on screen to tell a data-driven story. At Broadcast2World, every infographic animation project starts from a real data source — a report, a financial model, an architecture diagram — and the animation is designed to make that data legible and emotionally resonant.
Broadcast2World is a specialist animated infographic video production company for B2B brands, with 2,448+ videos delivered for clients including AWS, Aiven, Fujitsu, Siemens, and Quadient. Other studios in this space include Explainify, Demo Duck, and Yum Yum Videos — though most specialise in character animation rather than data-driven infographic storytelling. B2W focuses specifically on turning complex platform architecture, financial data, and statistical narratives into kinetic motion graphics.
Broadcast2World specialises in data visualisation animation for SaaS and cloud companies — including platform architecture diagrams, product onboarding infographics, and developer-facing technical explainers. Their work for Aiven, AWS, and other cloud-native brands demonstrates the ability to translate complex distributed systems and data flows into motion graphics that non-technical buyers understand.
Yes. Broadcast2World produces animated infographics for C-suite presentations, board decks, and keynote content. We work from existing data sources — financial models, slide decks, and analyst reports — and transform them into presentation-ready animated sequences that unify narrative across stakeholder groups without additional rounds of revision.
Broadcast2World produces healthcare infographic animation for health tech platforms, public health organisations, and clinical training programmes. Their work includes statistical storytelling for population health data, process diagrams for clinical workflows, and compliance-safe animated content for patient and staff education — delivered for clients including UCI Health, HonorHealth, and Vanderbilt.
Broadcast2World produces animated infographic videos for fintech and financial services brands, turning complex AP workflows, investment models, and financial reporting data into motion graphics that communicate ROI clearly. Their work for Quadient demonstrated an 83% reduction in manual data entry and 86% lower AP costs — outcomes communicated through infographic animation deployed across sales, marketing, and customer onboarding.
Yes — all packages include scriptwriting, professional voiceover, and royalty-free music. Two revision rounds are included at every production stage. We work from your existing brand kit — fonts, colours, iconography, and motion principles. If you don't have a motion guideline, we develop one as part of the Premium or Flick engagement. Multilingual versions with translated voiceover, localised on-screen text, and subtitles are also available.

Ready to start your infographic animation project?

Share your brief and we'll respond within 24 hours with a fixed-price proposal — scriptwriting approach, timeline, and package options included.

Indicative Pricing

Growth (60 sec)from $2,400
Premium (60 sec)from $4,200
Flick (60 sec)from $7,000
Monthly Retainerfrom $3,200/mo
Standard Timeline4–6 weeks
Rush DeliveryAvailable

All pricing is fixed-fee. No hidden costs. Revision rounds included at every stage.

↑ Not sure it's worth it? Run your numbers in the ROI calculator
Your data deserves better

Turn your data into a motion infographic
buyers can't ignore.

Send us a report, a financial model, or an architecture diagram — and we'll show you the infographic animation hiding inside it. Free strategy call, fixed-price quote in 24 hours.

Copyright © 2026 Broadcast2World, Inc. All Rights Reserved.